Grafana is a visualization tool that can handle different types of data related to network monitoring, IoT and Real-Time sensors, application performance, business, and operational or environmental and geographic data. Further, when it comes to Linux operating systems especially Ubuntu it not only provides a straightforward installation method but also smoothly integrates with various monitoring and logging tools, such as Prometheus, InfluxDB, and Loki.
3 Ways to Install Grafana on Ubuntu
Grafana comes with dashboard customization, allowing the display to be set per user preferences. Furthermore, to make the data secure different permissions can be assigned ensuring data is accessible to authorized individuals only, which helps to maintain data integrity and security. This guide will explain three ways to install Grafana on Ubuntu along with some configuration steps.
1: Through Grafana Repository
The first method for Grafana installation on Ubuntu is using Grafana’s repository, there are different versions of Grafana and the repository varies for each. For Grafana repository validation get its GPG key:
wget -q -O - https://apt.grafana.com/gpg.key | gpg --dearmor | sudo tee /etc/apt/keyrings/grafana.gpg > /dev/null

Grafana has two basic versions based on its repository: the enterprise and the OSS (Open Source Software). Further, there are beta versions as well for each and here I have installed the stable version by its repository using:
echo "deb [signed-by=/etc/apt/keyrings/grafana.gpg] https://apt.grafana.com stable main" | sudo tee -a /etc/apt/sources.list.d/grafana.list
After adding the repository it is necessary to refresh the apt packages list so for that execute:
sudo apt update
Now install Grafana via the apt package installer:
sudo apt-get install grafana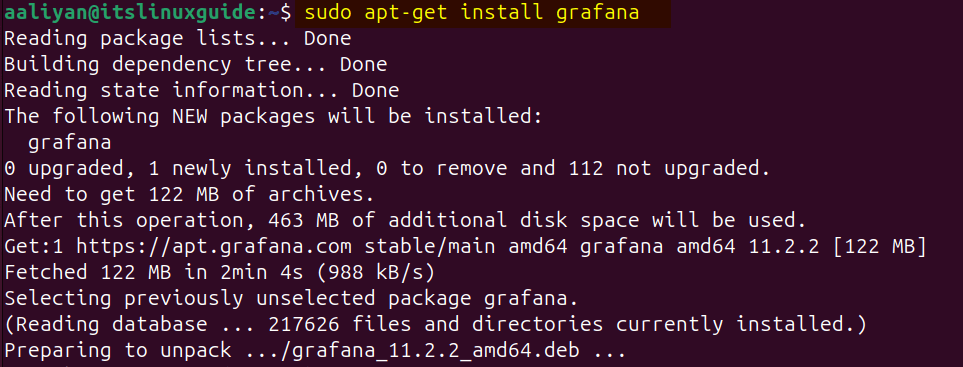
To verify the installation on Ubuntu check the version for Grafana by executing:
sudo grafana-server -v
Alternatively, you can use the below command to install the enterprise version of Grafana:
sudo apt-get install grafana-enterpriseHere in the table, I have listed the respective commands and repositories for Grafana versions:
| Grafana Version | Installation Command | Grafana repository link |
|---|---|---|
| Grafana Enterprise | sudo apt-get install grafana-enterprise | https://apt.grafana.com stable main |
| Grafana OSS | sudo apt-get install grafana | https://apt.grafana.com stable main |
| Grafana Enterprise (beta) | sudo apt-get install grafana-enterprise | https://apt.grafana.com beta main |
| Grafana OSS (beta) | sudo apt-get install grafana | https://apt.grafana.com beta main |
2: Through Grafana Deb File
The next method to install Grafana is using its deb file, but before going further three packages are needed to be installed: addsuer, libfontconfig1, and musl, for that use the below command:
sudo apt-get install -y adduser libfontconfig1 musl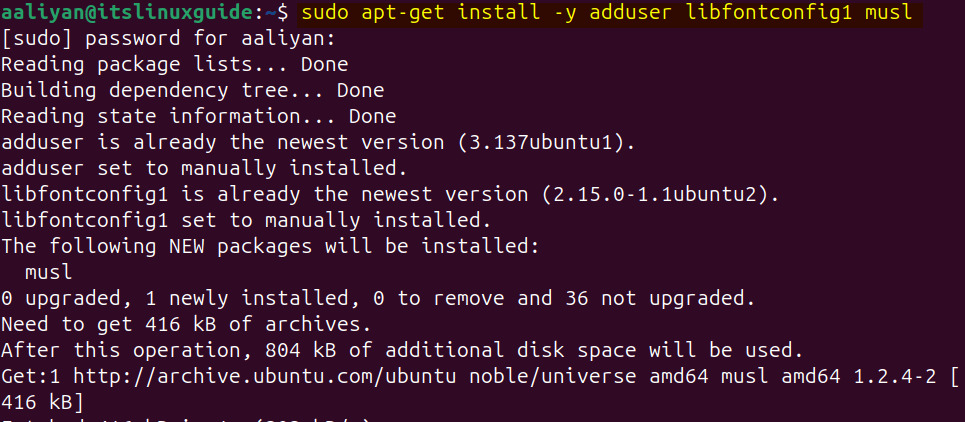
Next, download the deb file for Grafana, here I have downloaded the enterprise version:
wget https://dl.grafana.com/enterprise/release/grafana-enterprise_11.2.2_amd64.deb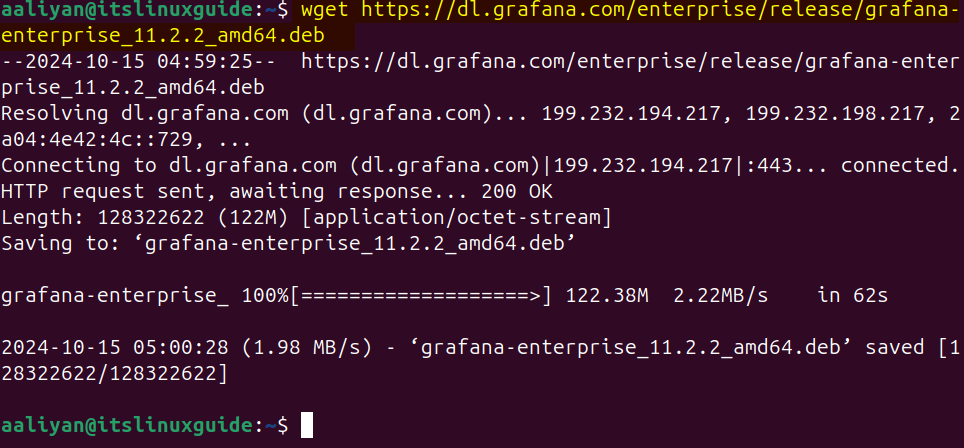
Next, use the apt package manager to install Grafana as in the command below:
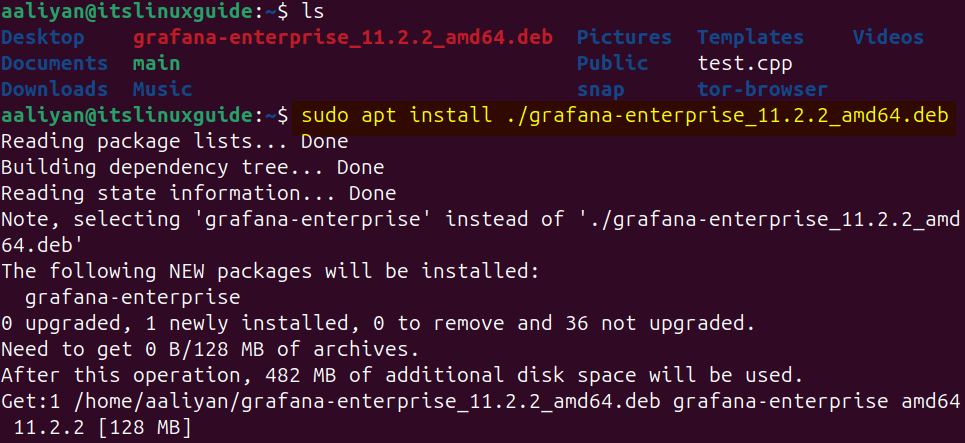
sudo apt install ./grafana-enterprise_11.2.2_amd64.deb
Next, just for verification purposes list the apt installed apps by executing:
sudo apt list --installed
Here in the table below, I have added the commands for installing both the enterprise and the OSS version of Grafana via its deb file:
| Grafana Version | Deb file Download Command |
|---|---|
| Grafana OSS | wget https://dl.grafana.com/oss/release/grafana_11.3.0_amd64.deb |
| Grafana enterprise | wget https://dl.grafana.com/enterprise/release/grafana-enterprise_11.3.0_amd64.deb |
In the above table I have given the links for the latest Grafana version, in case of an older version visit Grafana’s official site.
3: Through Grafana Source code
The last and third method for Grafana installation is using its tar file, here I have also downloaded its enterprise version using the below command:
wget https://dl.grafana.com/enterprise/release/grafana-enterprise-11.2.2.linux-amd64.tar.gz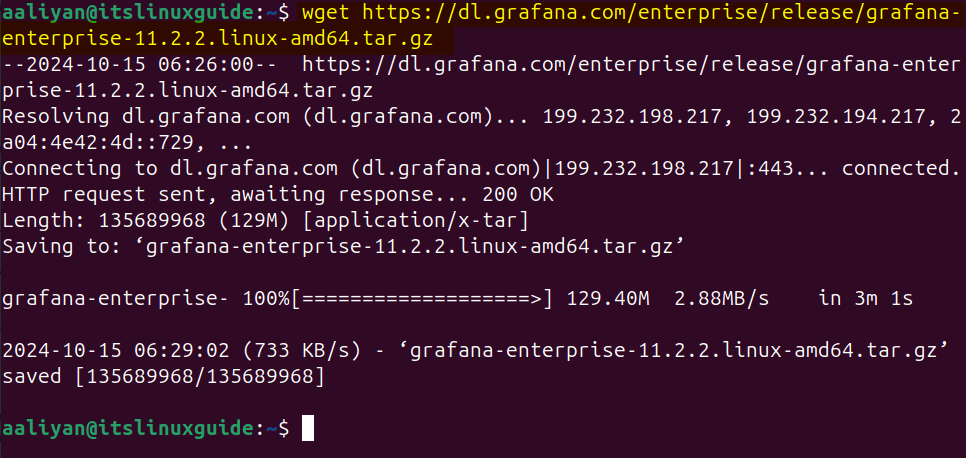
Next, extract the tar file via the tar utility as in the command below:
tar -zxvf grafana-enterprise-11.2.2.linux-amd64.tar.gz
To launch the server navigate to the bin directory of the extracted folder and then execute the bash file for grafana-server:
./grafana-server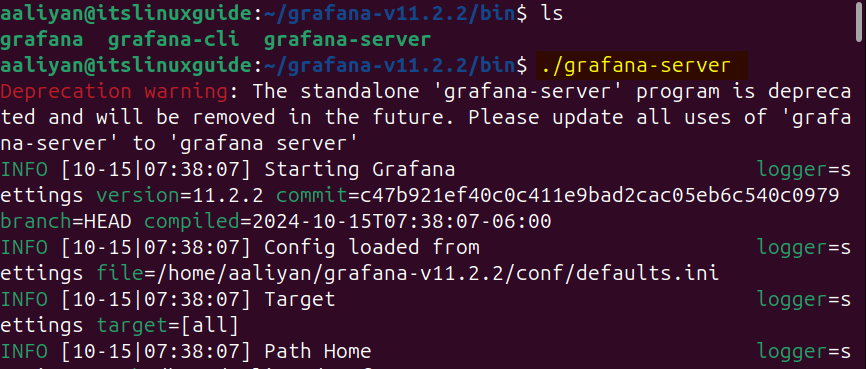
Here in the table below, I have added the commands for installing both the enterprise and the OSS version of Grafana via its tar file:
| Grafana Version | Deb file Download Command |
|---|---|
| Grafana OSS | wget https://dl.grafana.com/oss/release/grafana-11.3.0.linux-amd64.tar.gz |
| Grafana enterprise | wget https://dl.grafana.com/enterprise/release/grafana-enterprise-11.3.0.linux-amd64.tar.gz |
In the above table I have given the links for the latest Grafana version, in case of an older version visit Grafana’s official site.
How To Set up Grafana on Ubuntu
By default, the Grafana service might be active, but it needs to be enabled manually for sure so first start it and then enable it by executing:
sudo systemctl start grafana-server

sudo systemctl enable grafana-server
Next, reboot Ubuntu and then check the Grafana service status:
sudo reboot

sudo systemctl status grafana-server
To access the Grafana dashboard use the local IP address for the system: <localhost:3000/login> and to login for the first time use the admin as the username and password:
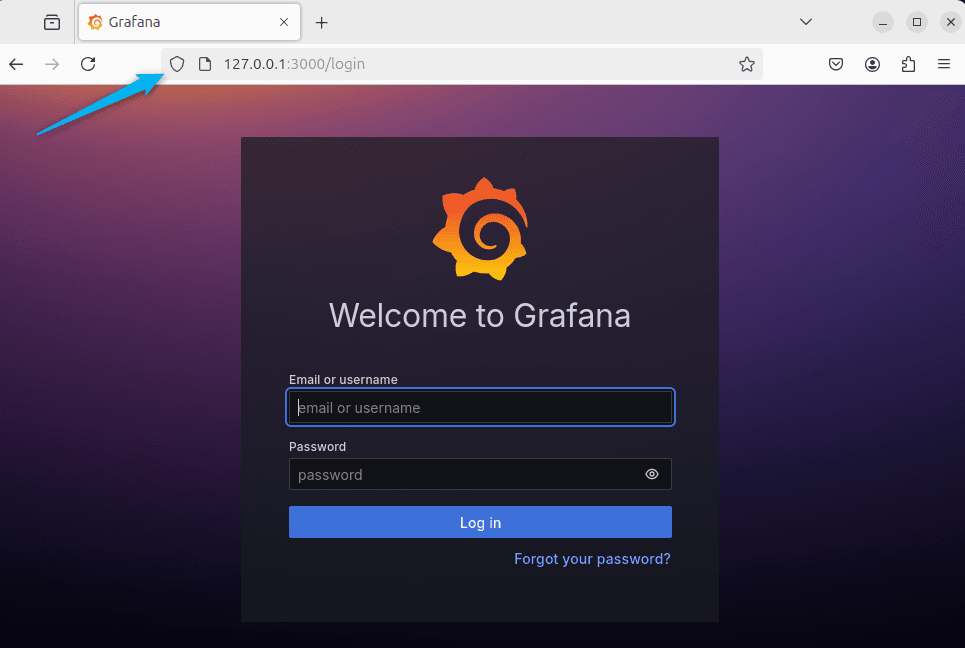
Next, set the new password and submit:
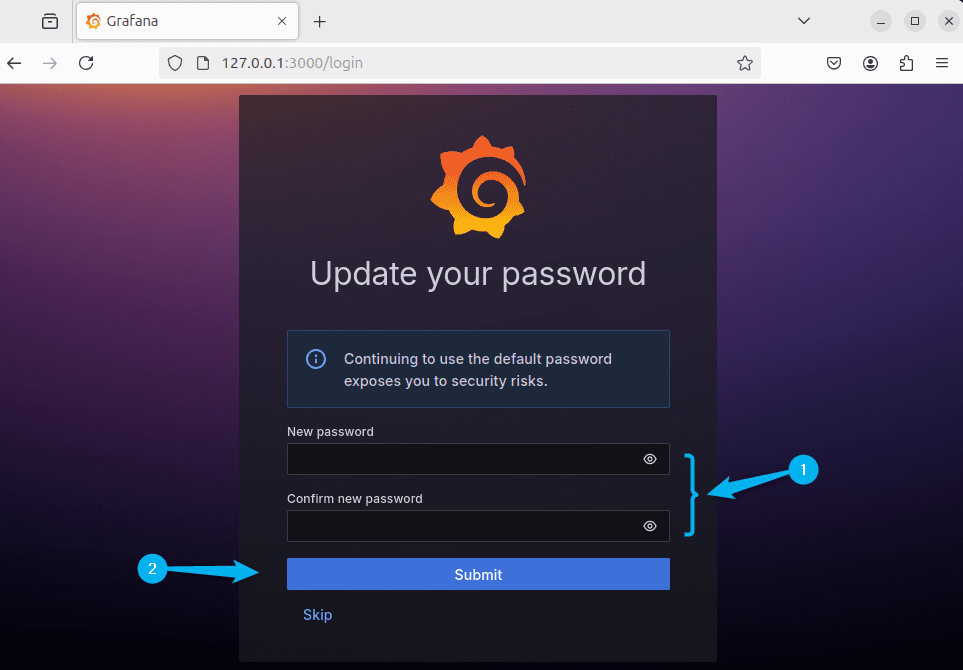
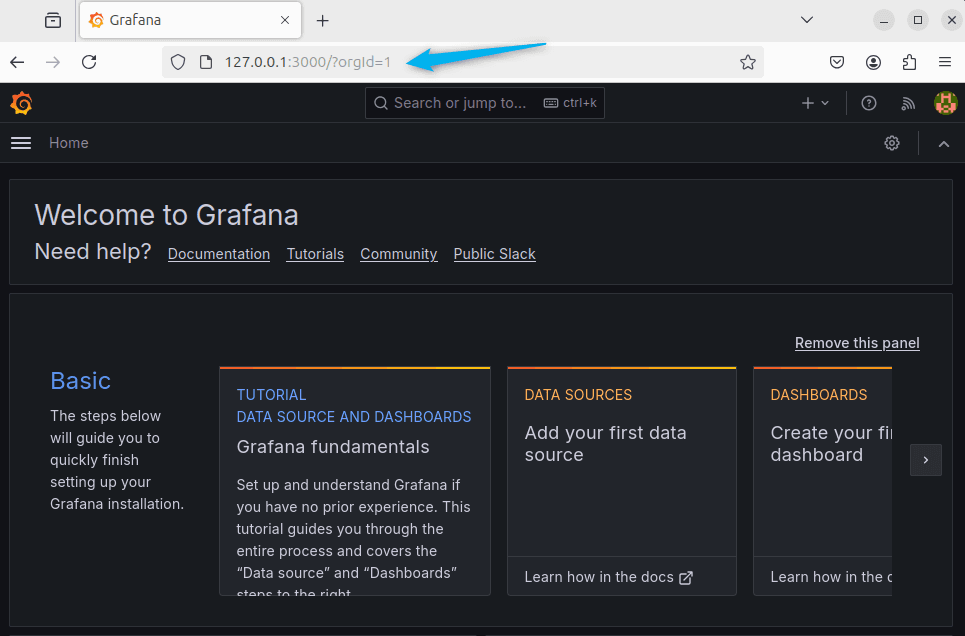
After setting or skipping the password settings option the default dashboard for Grafana will open:
Conclusion
This guide covered three ways to install Grafana on Ubuntu: its repository, deb file, and tar file. There are two versions in Grafana Enterprise and OSS. The OSS provides basic visualization and monitoring features for free, while the enterprise includes advanced features like enhanced security, data source plugins, and scalability options.

